Homework No. 4: H and C
Outline of Psychological Measurement

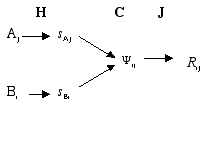
Response = J[C(H(A), H(B))]
Aj and Bi are the stimuli for Column j and Row i.
sAj and sBi are the subjective, scale values for the stimuli.
Y
ij is the subjective impression of the combination of Aj and Bi.Rij is the overt response to this combination.
H are the functions that assign subjective values to the stimuli.
C is the combination function combining the subjective values.
J is the judgment function that assigns responses to impressions.
In this assignment, we let J be the identity function;
i.e., Rij = Yij
Homework:
Make predictions for a 4 x 4, A x B, symmetric, factorial design using integers from 1 to 4
for levels of A and B. (sAj = Aj = j; sBi = Bi = i).
Plot predictions as a function of A with a separate curve for each level of B. Part A: H and J are identity functions. 1. Additive: Tij = sAj + sBi 2. Multiplicative: Pij = sAj sBi 3. Subtractive: Dij = sAj - sBi 4. Ratio: Rij = sAj/sBi Part B: Repeat Part A, but now let H be a power function (square): sAj = H(Aj) = A2
Similarly, let sBi = H(Bi) = B2 Part C: Repeat Part A, but substitute A.5 and B.5 for H(A) and H(B) (H(B) = square root of B). Part D: Repeat Part A, substituting log(A+1) and log(B+1) for H(A) and H(B). Part E: What remains the same, irrespective of H, for the additive model?
What changes? How can you use these graphical properties to separate H and C?
Given a new set of data, how would you decide what model is appropriate? How would you determine H?
Before you answer this question, organize your sixteen graphs for Parts A through D and additive, multiplicative,
subtractive, and ratio models.
by Michael H. Birnbaum, © 1974-2001, all rights reserved.