Correction of errata in Study 1:
Lippa, R. A. (2005). Subdomains of gender-related occupational interests:
Do they form a cohesive bipolar M-F dimension? Journal of Personality, 73, 693-730.
Richard A. Lippa
Richard Lippa
Psychology Department
e-mail: rlippa@fullerton.edu
Study 1
Data
The data came from Loehlin and
Nichols' (1976) classic behavior genetic study of 839 same-sex twin pairs (351
male pairs and 488 female pairs).2
In the early 1960s these twins completed during their senior year of
high school a number of self-report scales and questionnaires, including
Results
Occupational
preference items that correlated with sex at a level of .15 or greater were
identified as sex-linked, and by this criterion, 43 of 160 occupations were
classified as masculine and 32 of 160 occupations were classified as
feminine. Two principal components
analyses with varimax rotations were conducted, one on masculine items and the
other on feminine items. The analysis
of masculine items yielded five interpretable factors, and the analysis of
feminine items yielded four interpretable factors.3 Table 1 shows occupations that loaded .4 or
higher on each of the five masculine factors in a five-factor solution and on
each of the four feminine factors in a four-factor solution. A small number of items that loaded highly on
more than one factor were eliminated.
--------------------------------------------------
Insert Table 1 about here.
--------------------------------------------------
Not all masculine and feminine
subdomains were equally represented in the VPI list of 160 occupations. For example, there were only three
sports-related occupations, but there were thirteen blue-collar realistic
occupations. Because the VPI contains a
large, diverse set of occupations, the number of occupations representing each
factor probably roughly represents social reality -- e.g., there are many more
blue-collar realistic occupations than sports-related occupations in the
An overall masculine occupations
scale was computed by averaging individuals' preference for the 43
male-preferred occupations, and similarly an overall feminine occupations scale
was computed by averaging individuals' preference for the 32 female-preferred
occupations. The reliability of the
masculine occupations scale was .84 for all participants, .73 for males, and
.75 for females, and the reliability of the feminine occupations scale was .86 for
all participants, .79 for males, and .69 for females.
Table 2 shows the intercorrelations
of masculine and feminine occupational subdomains scales for men (above the
diagonal) and for women (below the diagonal). Masculine subdomain scales tended
to show both positive and negative correlations with one another, feminine
subdomains tended to show positive or zero correlations with one another for
men and positive and negative correlations with one another for women, and
masculine subdomain scales tended to correlate negatively with feminine subdomain
scales.
--------------------------------------------------
Insert Table 2 about here.
--------------------------------------------------
To reveal the structure implicit in
the intercorrelations in Table 2, principal components analyses were conducted
on masculine subdomain scales, feminine subdomain scales, and overall masculine
and feminine occupations scales.4
These analyses were conducted for males and females combined and for
males and females separately. Two principal components were extracted,
solutions were left unrotated, and factor scores for participants were computed
in all three analyses. Because masculine
and feminine subdomain scale items were selected because of their correlation
with sex, it seemed likely that the first principal component in the
combined-sex analysis would reflect a sex difference factor (i.e., a factor
that tapped the variance shared in common by all items). However, it was not guaranteed that this same
component would emerge in analyses for males only and for females only.
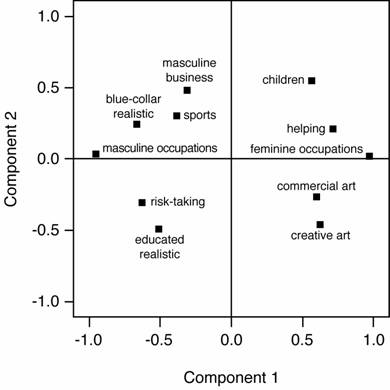
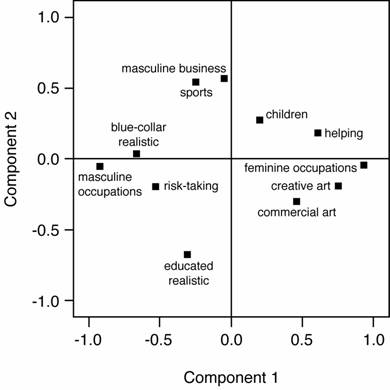
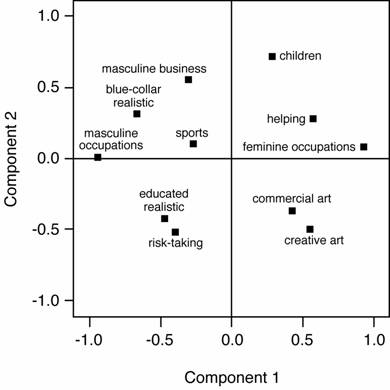
Figure 1 plots masculine and
feminine subdomain scales in the two-dimensional spaces generated by the three
principal components analyses. The first
principal component accounted for 43% of the variance in the combined-sex
analysis, 35% of the variance in the males-only analysis, and 33% of the
variance in the females-only analysis.
The revealed structure was very similar in all three analyses: masculine
subscales tended to lie on one side of the first principal component, and
feminine subscales tended to lie on the other side. The overall masculine and feminine occupation
scales, which served as marker variables, showed that the first principal
component was indeed a "sex difference" factor in the combined-sex
analysis. However, this same factor was
present in the analyses for males only and females only, and in these analyses
the first principal component is best described as an M-F dimension. It is worth noting that subdomain scales
formed a circular arrangement in factor space that was consistent with
--------------------------------------------------
Insert Figure 1 about here.
--------------------------------------------------
To probe the consistency of the
structure generated by the three principal components analyses, participants'
factor scores from the combined-sex analysis were correlated with factor scores
from the males-only analysis and from the females-only analysis. In both cases, the correlation of first
principal component factors scores was close to unity (r = .996 for males and r
= .994 for females, p's <
.001). These extremely high
correlations show that the first principal component identified an individual
difference dimension that was virtually identical in all three principal
components analyses, and they underscore the fact that the "sex
differences" dimension in the mixed-sex analysis was the same as the M-F
dimension in the males-only and females-only analyses.
The second principal component in all
three analyses can be interpreted as a version of the "Ideas-Data"
dimension, with "educated realistic" and artistic occupations (which
entail more creativity and theoretical thought) at one side of the second
component, and "blue-collar realistic," "masculine
business," "helping," and "children-related"
occupations (which involve more practically oriented work) at the other
side. Participants' second principal
component factors scores from the combined-sex analysis correlated highly with
the second principal component factor scores from the males-only analysis (r = .93, p < .001) and from the
females-only analysis (r = .98, p
< .001). The presence of this stable
second factor in all three analyses suggests that there were systematic
non-gender-related influences on the intercorrelations shown in Table 2.
For males and females combined,
masculine occupations were strongly negatively correlated with feminine
occupations (r = -.87, p < .001). Masculine and feminine occupations were also
strongly negatively correlated for males only (r = -.77, p < .001) and for females only (r = -.78, p
< .001) .
Discussion of Study 1
Analysis of the Loehlin and Nichols'
data showed that coherent subdomains of masculine and feminine occupational
interests could be identified from a large set of occupational preference
items. At the same time, structural
analyses of masculine and feminine occupational subdomain scales showed that
masculine subdomains scales tended to lie on one side of the first principal
component, feminine subdomains tended to lie on the other side, and therefore
that masculine and feminine subdomains tended to be bipolar opposites.
The structure of occupational
subdomain scales was highly consistent in all analyses -- for both sexes
combined, for males only, and for females only.
In all cases, the first principal component was gender-related,
reflecting sex differences in the combined sex analyses and individual
differences in M-F in males-only and females-only analyses. The second principal component appeared to
tap a version of the "Ideas-Data" dimension, and the presence of this
second dimension suggests that intercorrelations of masculine and feminine
subdomains scales were systematically influenced by factors other than the
masculinity or femininity of occupations – that is, when masculine scales (or
feminine scales) sometimes correlated negatively with one another, it was
because of differences on the second but not on the first principal
component. Participants' overall
preference for masculine occupations showed a strong negative correlation with
their overall preference for feminine occupations, and this was true whether
correlations were computed for both sexes combined or within each sex.
Table 1
Masculine
and Feminine Subdomain Items and Scale Reliabilities, Study 1
Masculine Subdomains
|
Blue-Collar Realistic |
Educated Realistic |
Masculine Business |
Risk-Taking |
Sports |
|
Airplane mechanic Auto mechanic Carpenter Construction inspector Crane operator Factory foreman Locomotive engineer Machinist Power shovel operator Power station Operator Tool designer Truck driver Wrecker (building) |
Aeronautical design engineer Chemist Electronic technician Experimental lab engineer Interplanetary scientist Physicist |
Bank examiner Banker Business Executive Financial Analyst Sales manager Stock and bond salesman Tax Expert |
Army general Army officer Aviator Counter- intelligence man Racing car driver Test pilot |
Professional athlete Referee (sporting events) Sports promoter |
|
α
= .86, .83, .86 |
α
= .82, .81, .78 |
α
= .74, .77, .66 |
α
= .71, .66, .62 |
α
= .70, .73, .59 |
Feminine Subdomains
|
Helping |
Creative
Arts |
Children-Related |
Commercial Arts |
|
Clinical psychologist Director of welfare agency Juvenile delinquency expert Marriage counselor Personal counselor Psychiatric case worker Social worker Speech therapist Vocational counselor |
Author Concert singer Composer Novelist Playwright Poet Dramatic coach |
Elementary school teacher Nursery school teacher Playground director YMCA secretary |
Art dealer Commercial artist Interior decorator Portrait artist |
|
α = .82, .74, .76 |
α = .80, .80, .77 |
α = .71, .46, .64 |
α = .71, .68, .63 |
Note: Reliabilities (α's) are
for all participants, males, and females.
Table
2
Intercorrelations
of Masculine and Feminine Subdomain Scales, Study 1
|
|
Blue-collar Realist |
Educat-ed Realist |
Masc Busi-ness |
Risk-Taking |
Sports |
Helping |
Creat Arts |
Child-Related |
Comm Arts |
|
Blue-collar Realist |
---- |
-.02 |
-.14* |
.19*** |
.08 |
-.38*** |
-.43*** |
.05 |
-.14** |
|
Educat-ed Realist |
.02 |
---- |
-.29*** |
.05 |
-.15** |
-.19** |
-.20*** |
-.11* |
-.11* |
|
Masc Busi-ness |
.21*** |
-.12** |
---- |
-.12* |
-.03 |
-.07 |
-.13* |
-.10 |
-.06 |
|
Risk-Taking |
.02 |
.17*** |
-.27*** |
---- |
-.01 |
-.24*** |
-.30*** |
-.21*** |
-.23*** |
|
Sports |
.10* |
-.09 |
-.03 |
.15** |
---- |
-.06 |
-.21*** |
.04 |
-.23*** |
|
Helping |
-.40*** |
-.18*** |
-.15** |
-.19*** |
-.13** |
---- |
.21*** |
.12* |
.00 |
|
Creat-ive Arts |
-.35*** |
-.17*** |
-.31*** |
-.10* |
-.17*** |
-.10* |
---- |
.00 |
.32*** |
|
Child-Related |
.07 |
-.34*** |
.09* |
-.33*** |
.07 |
.24*** |
-.16*** |
---- |
.00 |
|
Com-mercial Arts |
-.24*** |
-.15** |
-.17*** |
-.09* |
-.08 |
-.06 |
.34*** |
-.12* |
---- |
Note: Correlations for males are
above the diagonal, and correlations for females are below the diagonal.
* ----- 2-tailed p < .05
**
-----2-tailed p < .01
*** --- 2-tailed p < .001
Figure
1 (Revised)
Plots of
masculine and feminine subdomain scales in two-dimensional component space, for
all participants (top), males (middle), and females (bottom) in Study 1